
Using Data to Predict Industrial Demand Before It Happens
By Aaron Giron, Investment Analyst at CommercialGRP
Industrial real estate decisions are often made by looking at what is happening today: current rents, vacancy rates, recent sales, tenant demand, and available inventory.
But some of the most compelling opportunities emerge before the market fully reflects what is coming next.
That is why data analysis plays such an important role in our investment process at CommercialGRP. We are not trying to predict the future with certainty. Instead, we look for measurable signals that can help us understand where industrial demand may be heading—and whether a property fits our investment criteria.
Our focus is on evaluating industrial properties generally between 50,000 and 120,000 square feet, along with select retail opportunities. Within those markets, we want to understand not only what a property is worth today, but also the factors that could influence its performance over time.

Demand Usually Leaves Clues
Industrial demand rarely appears out of nowhere.
Before tenants begin competing aggressively for space, there are often indicators that conditions are changing.
These can include:
- Population growth
- Employment expansion
- Business formation
- Infrastructure investment
- New transportation routes
- E-commerce activity
- Manufacturing growth
- Port, airport, or rail activity
- Declining available inventory
- Rising rents
- Increased construction activity
No single indicator tells us that a market is about to experience significant demand.
The value comes from looking at several indicators together.
That’s where the analytical process becomes useful.

1. Population Growth Can Signal Future Demand
Population growth is one of the first data points I like to examine when evaluating a market.
More people can mean more households, more consumption, more businesses, and potentially more demand for goods and services.
But population growth alone isn’t enough.
I also want to know:
Who is moving there?
Are new residents contributing to the local workforce? Are businesses expanding? Is household income increasing? Are employers hiring?
These questions help us distinguish between population growth that may have limited commercial impact and growth that could support broader economic activity.

2. Employment Trends Tell Us About Economic Activity
Employment data can provide another useful signal.
When businesses are hiring, it can indicate that companies are expanding operations or that new businesses are entering the market.
For industrial real estate, I pay particular attention to sectors such as:
- Manufacturing
- Transportation
- Logistics
- Warehousing
- Distribution
- Construction
- Wholesale trade
The objective isn’t simply to find a market with low unemployment.
We want to understand what types of businesses are creating jobs and whether those industries require physical commercial space.
That distinction matters.

3. Infrastructure Can Change the Investment Landscape
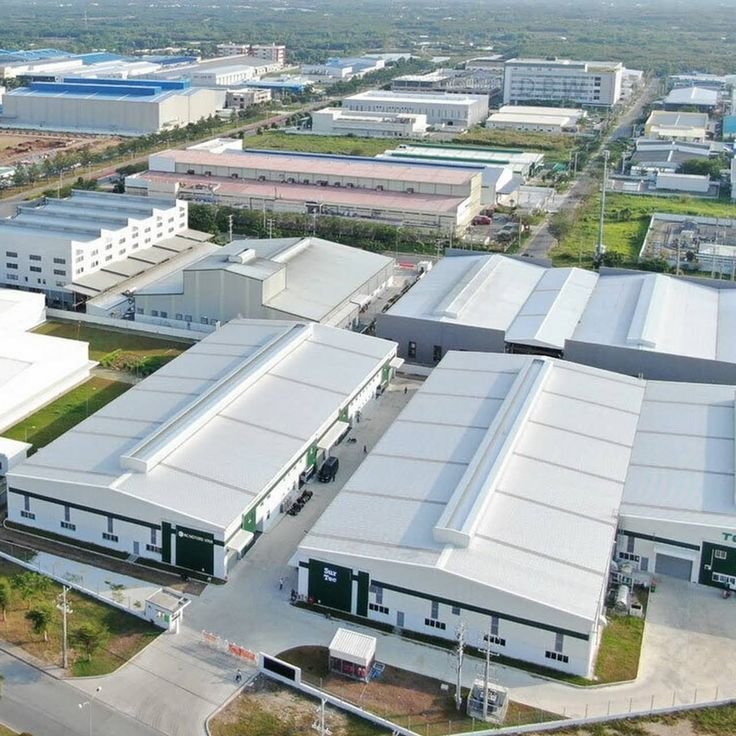
Infrastructure investment can fundamentally change how a market functions.
A new highway interchange, road expansion, bridge improvement, rail connection, or logistics project can improve accessibility and reduce transportation friction.
When access improves, certain locations may become more attractive to businesses.
This is why infrastructure deserves to be analyzed alongside property-level data.
A building might look average when viewed in isolation. But if it sits near improving transportation infrastructure, its future positioning could be very different.
I explore this relationship in more detail in How Infrastructure Investment Is Driving Industrial Demand.
4. Vacancy Rates Need Context
Vacancy is one of the most commonly discussed industrial market metrics, but it can be easy to misinterpret.
A low vacancy rate generally suggests limited available inventory.
That can create favorable conditions for landlords.
But the number itself doesn’t tell us everything.
We need to ask:
- Is vacancy declining?
- How quickly?
- What type of space is available?
- Are new buildings coming online?
- Where is the vacant space located?
- Are tenants leasing smaller or larger facilities?
- Are asking rents increasing?
- Is demand concentrated in specific submarkets?
For example, a market with 5% vacancy could be experiencing very different conditions from another market with the same vacancy rate.
This is why I view vacancy as one piece of the puzzle rather than a conclusion by itself.
Our previous analysis, What Vacancy Rates Really Tell Investors (And What They Don’t), explores this distinction further.

5. Rent Growth Can Confirm Emerging Demand
Rent growth is another important signal.
If tenants are consistently willing to pay more for industrial space, that can indicate that demand is exceeding available supply.
But again, the trend matters more than one data point.
I look at:
Current rent → historical rent → rate of change → competing supply → tenant demand
That sequence helps put rent growth into context.
If rents are increasing while vacancy remains low and new construction isn’t keeping pace with demand, the market may be showing stronger fundamentals.
On the other hand, rapidly rising rents combined with a large wave of new supply could produce a very different outlook.
Data needs context.
6. New Construction Can Tell Us What Developers Expect
This is one of the more interesting indicators.
Developers don’t build industrial properties randomly.
When developers are committing significant capital to a market, they are making a judgment about future demand.
That doesn’t mean every new development will succeed.
But construction activity can provide useful information about where market participants see opportunity.
We examine:
- New permits
- Construction starts
- Deliveries
- Development pipelines
- Building sizes
- Locations
- Asking rents
- Pre-leasing activity
The relationship between new supply and expected demand is critical.
A market with strong demand and limited new construction can present different opportunities from a market where supply is rapidly increasing.

7. Absorption Helps Measure Whether Demand Is Actually Materializing
Absorption measures how much space is being occupied over a specific period after accounting for space that becomes available.
In simple terms, it helps answer:
Are tenants actually taking space?
That makes absorption particularly useful when evaluating demand.
If a market is showing positive absorption over multiple periods, it can indicate that businesses are occupying more space than is being returned to the market.
But I still want to understand the reason behind the absorption.
Was it driven by one major transaction?
Is demand coming from several tenants?
Is it concentrated in one building size?
Are businesses expanding or simply relocating?
The underlying story matters.

8. Infrastructure, Demographics, and Jobs Become More Powerful Together
The most useful insights often emerge when different datasets point in the same direction.
Imagine a submarket where we observe:
- Population growth
- Increasing employment
- New transportation infrastructure
- Positive industrial absorption
- Declining vacancy
- Rising rents
- Limited available land for competing development
Individually, each metric provides information.
Together, they can create a much stronger picture of potential demand.
That is what I mean by connecting the dots between data and opportunity.
We aren’t looking for a single statistic that tells us what to buy.
We’re looking for patterns.

9. Timing Matters
Identifying a growing market is only part of the analysis.
The next question is:
Where are we in the growth cycle?
Buying after every positive indicator has already become widely recognized can result in paying a premium.
On the other hand, entering too early can mean waiting years for the expected growth to materialize.
This is why market-cycle analysis matters.
We consider whether growth appears to be:
- Emerging
- Accelerating
- Stabilizing
- Mature
- Slowing
The objective isn’t to perfectly time the market. That isn’t realistic.
Instead, we want to understand the risk and opportunity associated with the current stage of the cycle.

10. Property-Level Data Still Comes First
Strong market data does not automatically make a property a good investment.
This is an important distinction.
A rapidly growing industrial market can contain poorly located buildings, outdated facilities, unfavorable leases, excessive capital requirements, or pricing that leaves little room for error.
That’s why our process moves from market analysis to property analysis.
We evaluate factors such as:
- Building size
- Location
- Tenant profile
- Lease structure
- Occupancy
- Rent levels
- Operating expenses
- Physical condition
- Capital requirements
- Comparable properties
- Potential value-creation opportunities
The market tells us where to look.
The property tells us whether the opportunity is actually worth pursuing.

Turning Data Into Actionable Insight
One of the most important parts of analysis isn’t collecting information.
It’s communicating what the information means.
An investor doesn’t necessarily need a spreadsheet containing hundreds of data points.
They need to understand:
What does this tell us?
Why does it matter?
What could change the conclusion?
What risks should we be watching?
That’s where our Core Value of Outstanding Communication becomes particularly important.
My role isn’t simply to report numbers. It’s to help translate those numbers into information that can support better decision-making.

Data Doesn’t Eliminate Risk
It’s also important to be honest about what data can and cannot do.
No model can guarantee future demand.
Economic conditions can change. Businesses can relocate. Interest rates can move. New developments can alter supply. Infrastructure projects can be delayed.
Good analysis doesn’t eliminate uncertainty.
It helps us understand uncertainty more clearly.
That’s why we prioritize accuracy, consistency, and transparency in our research.
Our Core Values of Motivation & Commitment, Self-Reliance & Detail-Oriented execution, and Honesty & Integrity shape that process. We want the information we present to be useful, defensible, and clear about both opportunities and limitations.

Looking Beyond Today’s Market
At CommercialGRP, our goal isn’t simply to identify industrial properties that look attractive today.
We want to understand what could influence their performance tomorrow.
That means looking beyond asking prices and current occupancy to examine the broader forces shaping a market:
People. Jobs. Infrastructure. Supply. Demand. Rents. Development. Business activity.
When those factors begin moving in the same direction, they can provide valuable clues about where industrial demand may be headed.
And when we combine those market signals with disciplined property-level underwriting, we can make more informed acquisition decisions.
Ultimately, that’s how data becomes useful.
It doesn’t tell us exactly what will happen. It helps us recognize what may be happening before it becomes obvious.

Connecting Data With Opportunity
At CommercialGRP, we evaluate industrial properties in the 50,000–120,000 square-foot range, as well as select retail opportunities, with a focus on assets that can create lasting value.
For us, that value extends beyond financial performance. The right acquisition can support businesses, improve properties, strengthen local economic activity, and contribute to communities.
If you’re a broker with an industrial or retail opportunity that may fit our criteria, or an investor interested in understanding how we evaluate markets and properties, I’d welcome the opportunity to connect.
The best opportunities often start with the right information—and the right conversation.
Let’s connect and explore where the data may be pointing next.
This content is for informational purposes only and should not be considered legal, tax, financial, or investment advice. Investors should consult qualified professionals regarding their individual circumstances and applicable IRS regulations.